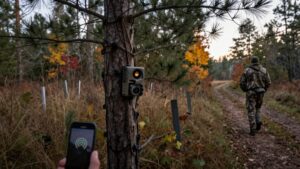
How to Do a Trail Camera Deer Survey and Estimate Your Herd
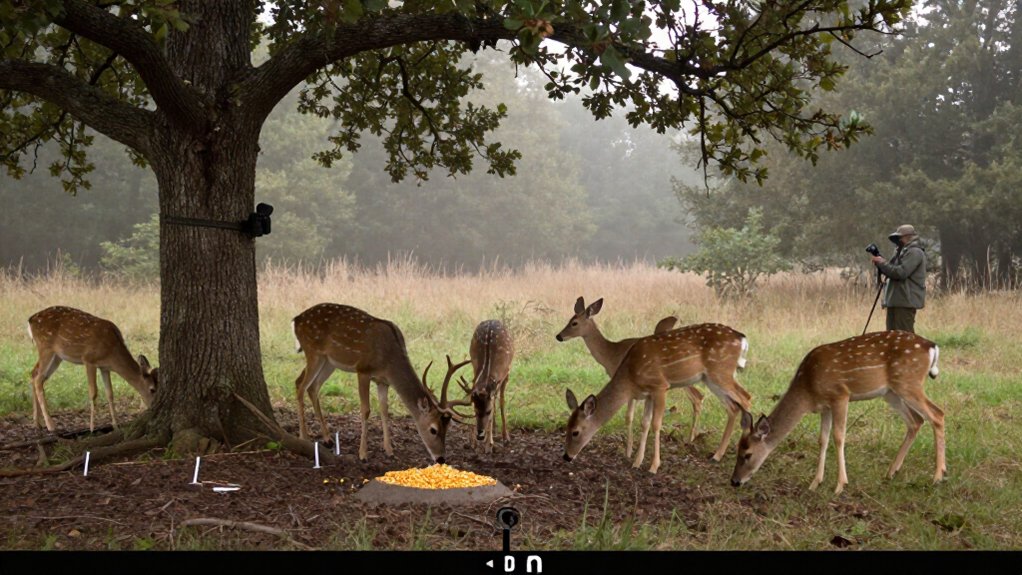
To estimate your deer herd, establish evenly spaced baited camera stations at deer-sign sites, pre-bait them for 4 to 6 days, and run identical 24-hour settings for 10 to 14 consecutive days.
Use batteries and SD cards, clear vegetation, and test framing. Identify unique bucks, divide them by total buck photos, then apply that ratio to doe and fawn photos. Adjust totals for survey length, calculate deer per acre, and remove bait afterward. The steps below refine your estimates.
Photo-Based Deer Density Estimate
A photo-based deer density estimate starts with a complete count of all buck, doe, and fawn photos from your active survey. Identify unique bucks using recognizable antler configurations, body marks, or other consistent traits. Divide the unique-buck count by total buck photos to calculate the unique-buck ratio. If you identify 10 bucks in 100 buck photos, your ratio is 10%.
Apply that ratio to doe and fawn photo totals to estimate unique animals. At 10%, 300 doe photos represent 30 does. Add estimated unique bucks, does, and fawns. Correct for unphotographed deer: multiply a 14-day total by 1.11 or a 10-day total by 1.18. Finally, divide the adjusted herd estimate by your property acreage, using consistent units, to report deer per 100 acres.
Check Batteries and SD Cards
Keep cameras running throughout the 10 to 14-day survey by checking batteries and SD-card capacity before either can interrupt image collection. Verify function and image quality the day after installation, before counting survey images. This early check identifies weak power, poor framing, or unreadable files while corrections won’t affect the study period.
- Pack fresh batteries for every service visit.
- Carry empty replacement SD cards.
- Label each card with camera site identification.
- Record card installation and removal dates.
- Minimize subsequent visits to essential servicing only.
At necessary check, replace depleted batteries and near-full cards promptly. Log the camera location, card identifier, and survey dates in a field sheet. These records preserve the link between every image, its station, and its sampling interval, preventing misclassification during density calculations.
Step 1: Establish Baited Camera Stations
Establish baited camera stations on a systematic grid so each site samples deer activity across the property rather than concentrating only on high-use areas. Map the property into evenly distributed blocks, then you’ll select accessible locations with deer sign, including trails, food-plot edges, or active scrape lines. Follow local baiting regulations and keep stations away from feeders that obstruct the view.
Scatter 20 to 25 pounds of shelled corn per station and pre-bait for at least four to six consecutive days; seven to 10 days also works. Mount cameras 15 to 20 feet from bait, aim north when possible, and clear vegetation or debris. Number every station, place its label in frame, and map its coordinates for reliable image organization and support consistent population estimates across survey sites.
Step 2: Set Cameras to 24-Hour Mode
Once pre-baiting is complete, set every camera to 24-hour operation and begin the active 10 to 14-day survey period. This setting documents deer visits during daylight and darkness, reducing bias from differences in movement timing. Apply identical operating settings at every station so photo counts remain comparable across the property.
Set each camera’s trigger delay to at least five minutes. This interval limits strings of nearly identical photographs from a single visit, reduces file volume, and makes subsequent identification and counting more consistent. After installation, inspect a sample of images from each station. Confirm that the camera detects deer, frames the bait site, and produces images in both light conditions. Archive or label pre-baiting photographs separately; don’t include them in the active survey dataset.
Step 3: Run Survey for 14 Days
Run the active survey for 14 consecutive days, using identical camera settings, bait protocols, and station timing across the property. This duration provides more coverage than a 10-day effort: you can expect to photograph roughly 90% of deer using the area versus about 85% in 10 days. Record start and end times and include only images captured within that 14-day interval in your dataset. Keep pre-baiting photographs in a separate folder so they don’t inflate survey counts.
Visit stations only when necessary to replenish bait, replace batteries, or swap memory cards. Make checks efficient and consistent to limit disturbance. After deriving your survey-based population estimate, multiply it by 1.11. This adjustment accounts for the 10% of deer that weren’t photographed during the active period.
Step 4: Identify Unique Antlered Bucks
Begin the photo review by identifying each antlered buck as an individual, not merely as another buck image. Compare every buck photograph for tine patterns, point counts, beam shape, asymmetry, and other stable antler features. Then verify matches with body traits, including scars, coat markings, ear damage, chest depth, and facial characteristics, because lighting, angle, and posture can alter appearance.
Create a record for each individual and assign it one count, while retaining every buck photograph in the total-image count. Divide unique bucks by total buck images to calculate the unique-buck ratio. If you identify 10 bucks in 100 buck photos, the ratio is 10 percent. Apply this ratio to doe and fawn image totals: 300 doe images at 10 percent estimate 30 does.
Step 5: Reposition Cameras With Obstructed Views
Reposition any camera with vegetation, limbs, or debris in its field of view, as these obstructions can block deer, trigger the flash, and reduce photo quality. Clear each station to create roughly 25 by 25 feet of open ground. Select a semi-open location with a closed background, ideally a tree line 10 to 15 yards behind the bait, so subjects separate clearly from the scene. Mount the camera 15 to 20 feet from the bait-site center and review test images.
Verify that the bait sits near the frame center and that deer-sized subjects fall within the unit’s effective detection and illumination range. Face the camera north when site conditions allow. This orientation limits direct sun, backlighting, and exposure variation for identification and counts.
Step 6: Remove Bait and Flagging Tape
Once you’ve collected the final survey photos and removed all equipment, clear each station of remaining bait, flagging tape, and other temporary markers. Treat cleanup as a required closing step, not an optional field chore. Visit every mapped location, including sites served by rotating cameras, and document completion on your station checklist.
Remove leftover bait completely rather than scattering or relocating it nearby; residual feed can continue attracting deer and non-target wildlife, altering normal movement after sampling ends. Collect tape, stakes, labels, and any materials used to identify camera positions. Dispose of bait according to local regulations and land-manager requirements. A consistent cleanup protocol prevents abandoned markers, reduces wildlife attraction, and leaves the property in the same operational condition that existed before the survey.
Calculate Buck-to-Doe Ratio
After you compile the active-survey records, estimate the buck-to-doe ratio from photo frequencies and unique-buck identifications rather than treating every image as a different deer. Count every buck and doe photograph, including repeat visits, then identify unique bucks by antlers or consistent body features. Divide unique bucks by total buck photos for the ratio.
If you identify 10 bucks in 100 buck photos, your ratio is 10 percent. Apply that percentage to total doe photographs to estimate unique does: 300 doe photos × 0.10 equals 30 does. Next, divide estimated does by unique bucks for the doe-to-buck ratio; 30 divided by 10 equals 3:1.
Invert it to report 1:3 bucks to does. This remains an estimate because sexes may not visit bait or cameras equally.
Fix Vegetation False Triggers
Reliable sex-ratio estimates also require clean image data, so eliminate vegetation that can fire the camera without a deer present. Clear standing plants, overhanging limbs, and downed debris from each camera’s field of view. Establish about twenty-five feet by twenty-five feet of open ground around the survey location, reducing wind-driven motion and visual obstruction. Select a semi-open site rather than aiming toward brush or low branches.
| Inspection point | Corrective action |
|---|---|
| Frame contains vegetation | Reposition camera or remove obstruction |
| Nearby plants move in wind | Clear vegetation and retest |
After installation, review test images under expected conditions. You’ll detect stems or limbs entering the frame before sampling starts. Correct triggers now, then repeat the test until images show only the detection zone. This controls nondeer photographs.
Store Cameras With Desiccant
Between surveys, protect each trail camera from moisture-related corrosion and condensation by storing it with a desiccant packet. Before packing, switch the unit off and remove its batteries. This limits battery leakage during storage. Place each camera and packet in a sealed storage container or airtight bag, limiting exposure to humid ambient air.
Keep units separated or padded to prevent lens, housing, and sensor damage during transport or storage. Record the storage date and inspect desiccant status before the next deployment. Replace single-use packets or recharge reusable material according to the manufacturer’s instructions. Once saturated, desiccant no longer removes water vapor effectively, allowing condensation risk to rise. This controlled storage step helps preserve electronics and reduce equipment-related data loss during your next deer survey.
Conclusion
By standardizing stations, operating cameras continuously, and limiting the survey to 14 days, you produce data that support repeatable herd estimates. You’ll improve accuracy when you verify batteries, cards, bait status, and false-trigger sources before analysis. Calculate observed buck-to-doe ratios from identifiable adults, then compare results across identical annual surveys.
Remove attractants and markers afterward, and store equipment dry. Your records won’t replace population modeling, but they’ll provide defensible trend data for management decisions locally.